
What metrics do you collect to analyze your scrum team?
We live in a world of data and information. Some people have a mindset that numbers will diagnose all problems – “just show me the data.” Therefore many directors and senior managers wish to see some list of metrics that should indicate the productivity and efficiency of the Scrum team. I personally believe this is something that can be felt, that human intuition is much better in this decision realm than the data that can be collected. However, one would have to actually spend time and carefully observe the team in action to get this powerful connection to the energy in a high-performing team space. Few leaders are willing to take this time, they delegate this information synthesis task to managers via the typical report/dashboard request. Therefore we are asked to collect data, to condense this data into information, all while ignoring the intangible obvious signals (read Honest Signals by Sandy Pentland of MIT).
What if you could perform the same Sprint 1000 times, with a fresh team each time, what might the data show us? Here's an analogy - an experiment run 800 times: push an unsteered bicycle and track the front wheels path to rest. Once is random; yet patterns appear in aggregate. Study the patterns and one can understand the underlying nature of the system.

This is a list of possible metrics one could collect. Assuming this list of metrics is good enough (not perfect and not for everyone), how would one actually implement and calculate these metrics? Will it take a super computer or a 17-page spreadsheet full of rows and columns? I really don't think so, but let's try a few and see how onerous it may be to have good measures of a team's performance.

Planned capability of the sprint (in story points)


Scope increase/decrease during the sprint/release.

Technical debt incurred this sprint (in story points)

Impediments discovered/removed/escalated
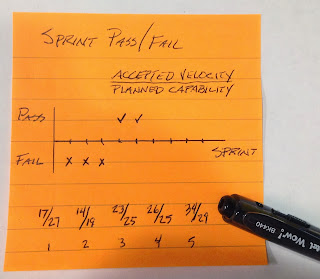
In the CHAOS report the Standish Group defined project success as: on time, on budget and with designed scope. If that is the definition of a project success, why don't we use it as the definition of sprint success? Then the self-similarity of the Scrum sprint will be a fractal of the project. Let's define success of a sprint as on time (within the time box), on budget (typically just the Scrum team remains static or has the previously defined growth in personal), and with the agreed upon scope (the team delivers very close to the sprint plans in terms of stories or story points of potentially shippable working tested application). Make this metric binary (pass/fail). Track this metric sprint after sprint. If the team fails in a sprint to deliver a successful sprint, expect them to correct this behavior if they wish to deliver a successful project. When a team is not capable of successive sprint passes in a long streak of measuring this metric, then the risk flag should be thrown on the playing field. What would you think of a team that had 47 sprints of passes in a row? Is that a good thing?
ODIM - a metric selection tool; by Larry Maccherone
Agile Metrics - The Good, the Bad, and the Ugly a great Lead Time article
Team Metrics a case study for a beginning scrum team
Measuring What Actually Matters - VersionOne
 |
| It's the Trends of Metrics that matter. |
What if you could perform the same Sprint 1000 times, with a fresh team each time, what might the data show us? Here's an analogy - an experiment run 800 times: push an unsteered bicycle and track the front wheels path to rest. Once is random; yet patterns appear in aggregate. Study the patterns and one can understand the underlying nature of the system.

 |
| How to Lie with Statistics |
These metrics are suggested at the team level for team self-management. It may be counterproductive to the team to allow these metrics outside of the team space. If micromanagement of the team results when these metrics are published then you have an organizational impediment that stifles visibility. Resolve that before you hurt the team by allowing too much visibility into the "sausage factory."
Velocity (in story points) "Done"
This is the number of story points that were completed by the team "done" in this one sprint – not an average, not an estimate, no partial credit given, etc. This is an empirical measure of the teams capability to turn stories into working software. One can debate weather stories that are fixed defects should be counted in the velocity. I say no. Assuming that this is the team that created the defect, then this is the team that warrants its work against defects. An auto mechanic doesn't get paid twice for adjusting the carburetor and then fixing the adjustment because the car stalls at a stop sign. Simply sum the done stories’ points. Units are story points, not hours nor ideal days. Track the velocity as a trend over sprints. [See Accepted Velocity below.]


Accepted Velocity - Story points done and accepted by PO in the sprint
At the end of the sprint, the done stories are demonstrated to the Product Owner (PO). The PO is then asked if this story is accepted – yes, he/she needs to make a quick assertion. “I'll let you know next week” is not acceptable. It's a yes/no immediate feedback required moment. If there is hesitation – guess what? – you have an impediment. Maybe having multiple conversations along the development path with the PO and showing him/her intermediate builds will help. With a mature effective team the Accepted Velocity measure will be insignifanctly different from the Velocity Done that there is no need to keep both measures. But if the statistics (like average) are not virtually the same then exposing this difference may help bring them into alignment with the Agile purpose - working software each sprint. See: Definition of Ready & Done & Acceptance Criteria.
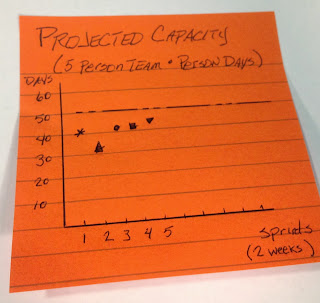
Projected capacity (in person days) of next sprint
This is the number of person days of work we expect the team will work in the next sprint. This metric should be relatively stable, except around holidays and flu season. If it is erratic, then you have an impediment. Look around, look in the mirror – the problem may be you! A common question is who counts and who does not count toward this metric? My response is that if a person works day in and day out to deliver the sprint objective (working software) then he/she counts, regardless of his/her title or role. If they are less than 35% assigned to the team, then I don't count them at all. It will be more trouble to find them and ask them for information than their contributions yield – treat them as overhead. Oh, and you have an impediment.
Have the team project person-days for the coming sprint; sum them up. Units are person days (resolution of half days or greater – not hours!). Track the team’s projected capacity as a trend over sprints.

Projected capability (in story points range) of next sprint
Either before planning or first agenda item in the sprint planning session, project the team's capability for this sprint. The purpose of this metric is to give the team a goal range to shoot for – not one post that must be struck. Imagine a football (soccer) goal – anywhere within the net counts. Take the average velocity (now you get to do some high math – make it a running average – say five sprints for a mature team) and adjust it for abnormal projected capacity. Then, apply a plus/minus range to it that covers the typical variance over the last few sprints. Assuming you have achieved a stable capacity, then an adjusted term of the equation is just needed around holiday season. Look at the last several sprint and find the variance (the highest velocity minus the lowest velocity = variance). Your projected capability is 1/2 variance +/- the running average. Or if you wish to get fancy with the math skew the variance toward the pessimistic side of your average velocity because velocity is an optimistic measure.

Planned capability of the sprint (in story points)
This is the amount of story points the team accepts into their sprint. Let's hope they have the good sense to keep it between the goal post of projected capability. If they don't, someone should be asking why five times. There are reasons to aim outside the goal post, but you better be an expert at bending it like Beckham. Planned capability is simply the sum of stories’ points in the sprint backlog when the planning meeting is finished. Track this metric sprint over sprint and compare it to velocity.

Stories started but not done (in story points and stories)
Ideally these two metrics trend toward zero and become easy to count. Sum up the number of stories that were started but didn't get done or accepted by the PO. Sum up all the story points that the team started but didn't get done/accepted. This is a measure of wasted work. Reduce the next sprint's planned capability by this amount. This metric when used well tends to make the team split stories into smaller valuable pieces
Discovered work added to the backlog (in story points and stories)
High-performing teams do not waste a lot of time planning for everything that they could possibly do in the future. They allow that the discovery of work will happen, and they adapt. However, if your team is finding more work each sprint than they can accomplish in a sprint, then you have a never-ending project. You better add some visibility to this (both inside the team and outside the team). Don't forget to add in the deferred work that has to happen at release time. This can take on many forms: technical debt, documentation, database rollback scripts, system testing on production equipment/environment, etc. Tracking this discovered work each sprint and showing it on a burndown chart makes a very engaging graphic and is very useful in release planning.

Scope increase/decrease during the sprint/release.
Similar to discovered work, track organizational imposed scope changes (in story points and number of stories). If this trend line doesn't become stable and near zero, then your product is at high risk. You have impediments or maybe your Product Owner doesn't have vision and is just making it up as he/she goes along.

Technical debt incurred this sprint (in story points)
I hope you are using the term 'technical debt' in its technical meaning (a business decision to use an inferior solution with a plan for rectifying this short-cut to gain a business objective). If so, you want to have a pay-back plan. An effective plan for repaying the debt incurred, requires one to know the principle amount. Continually sum up the technical debt incurred and show this trend line added to your backlog. Track how this debt is helping to achieve the business objective. If you cannot name the objective you are achieving then this is not technical debt. It is just poor engineering practice sometimes referred to as incompetence.
Cost of sprint
What does your development team cost per sprint? HR should be able to give you a cost multiplier for an average salary to account for benefits and overhead. Use that factor and the actual salaries of the team to derive the cost of the team. Do you want to include all the overhead people? It's up to you. I like to know the team's cost and the program cost (this is where multiple teams and the overhead are best reflected). If your organization believes in the team visibility aspects of Agile, then they will see this visibility as a two-way street and share the cost of all teams with team members. So if you have multiple teams all over the globe, they will understand the cost dynamics behind this decision. Maybe it also will help them deal with the dislocated-team issues better. Human dynamic issues aside, knowing the cost of the team helps the team decide when to quit adding features to a design dead application.

Impediments discovered/removed/escalated
I like to start with the simplest measure of the Scrum process. This is it. If it is working, then the only guarantee is that it will present the organization with impediments to the team. If these discovered impediments are being removed, then the process is working. If no impediments are being discovered, then your process adoption has failed. And, guess what? The problem is not the team; it is the team's leadership.
Sprint - pass/fail - Predictability
 |
| Failure or 'How Fascinating?' |

These are some metrics you could use to help the team self-manage their work and increase their effectiveness in delivering value in the form of working tested software. These are not the only metrics one could collect. The larger question is not what metrics to collect, but how does one use those metrics to make decisions. What indicates that the trend is moving out of bounds? What are acceptable bounds for each metric? When we implement a given intervention, what are our predictions for how this will effect the metric trends?Do these simple cause and effect behaviors actually hold true in our complex system? Are we measuring the right things (not are we measuring right)? When should we quit collecting data for a metric because it is no longer needed to assess a given behavioral change?
These are metrics that one should record and plot trends to inform decisions. Combining multiple metric trends into one graphic such as an enhanced release burn-down graph (an info-graphic) is a powerful tool for informing decision makers.
"Be careful what you measure...
because that is what you're going to get."


"Programming is a kind of "lossy compression." The thinking that comprises the majority of the effort isn't directly visible in the end work. Only the final, working solution chosen by the developers is present in the code."
ODIM - a metric selection tool; by Larry Maccherone
Agile Metrics - The Good, the Bad, and the Ugly a great Lead Time article
Team Metrics a case study for a beginning scrum team
Measuring What Actually Matters - VersionOne

Ten Essential Metrics by Jeff Sutherland.
Scrum metrics by Bob Boyd.
Visualizing Agility: Agile Metrics that Matter by Jay Packlick
Agile Metrics by D. André Dhondt.
Team metrics: who and why by Andrej Ruckij.
Because creating the right measurement can be difficult, we need simple guidelines on how to proceed by A. Blanton Godfrey.
Measuring Agile Team Performance by Kenny Rubin.
“Software Moneyball” by Troy Magennis Big Visible podcast at Agile 2014 - using metrics for a quantitative approach to software project management.
10 Tips for Measuring Agile Success from State of Agile survey analysis by Matthew Badgley - VersionOne Blog
Comments