

In the practice of Scrum many people appear to have their favorite method of
calculating the team's velocity. For many, this exercise appears very
academic. Yet when you get three people and ask them you will invariability
get more answers than you have belly-buttons.
This pamphlet describes the method I use to teach beginning teams this one very important Scrum concept via a photo journal simulation.
Some of the basic reasons many teams are "doing it wrong"... (from my comment on Doc Norton's FB question: Hey social media friends, I am curious to hear about dysfunctions on agile teams related to use of velocity. What have you seen?
Day 1 - Sprint Planning
A simulated sprint plan with four stories is developed. The team forecast they will do 26 points in this sprint.

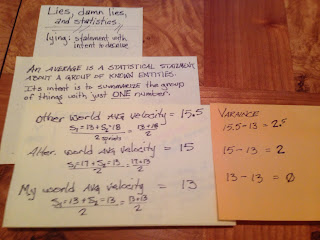
Velocity—the rate of change in the position of an object; a vector quantity, with both magnitude and direction.
“Calculus is the mathematical study of change.” — Donald Latorre
This pamphlet describes the method I use to teach beginning teams this one very important Scrum concept via a photo journal simulation.
Some of the basic reasons many teams are "doing it wrong"... (from my comment on Doc Norton's FB question: Hey social media friends, I am curious to hear about dysfunctions on agile teams related to use of velocity. What have you seen?
- mgmt not understanding purpose of Velocity empirical measure;
- teams using some bogus statistical manipulation called an average without the understanding of the constrains that an average is valid within;
- SM allowing teams to carry over stories and get credit for multiple sprints within one measurement (lack of understanding of empirical);
- pressure to give "credit" for effort but zero results - culture dynamic viscous feedback loop;
- lack of understanding of the virtuous cycle that can be built with empirical measurement and understanding of trends;
- no action to embrace the virtuous benefits of a measure-respond-adapt model (specifically story slicing to appropriate size)
- breaking the basic tenants of the scrum estimation model - allow me to expand for those who have already condemned me for violating written (or suggesting unwritten) dogma...
- a PBL item has a "size" before being Ready (a gate action) for planning;
- the team adjusts the PBL item size any/ever time they touch the item and learn more about it (like at planning/grooming);
- each item is sized based on effort/etc. from NOW (or start of sprint - a point in time) to DONE (never on past sunk cost effort);
- empirical evidence and updated estimates are a good way to plan;
- therefore carryover stories are resized before being brought into the next sprint - also reprioritized - and crying over spilt milk or lost effort credit is not allowed in baseball (or sprint planning)
Day 1 - Sprint Planning
A simulated sprint plan with four stories is developed. The team forecast they will do 26 points in this sprint.

Day 2
The team really gets to work.

Day 3
Little progress is visible, concern starts to show.

Day 4
Do you feel the sprint progress starting to slide out of control?


Day 5
About one half of the schedule is spent, but only one story is done.


Day 6
The team has started work on all four stories, will this amount of ‘WIP’ come back to hurt them?

Day 7
Although two stories are now done, the time box is quickly expiring.

Day 8
The team is mired in the largest story.


Day 10
The Sprint Demo day. Three stories done (A, B, & D) get demoed to the PO and accepted.


Backlog grooming (refinement) is done to prepare for the next sprint planning session.

Now let’s move from the empirical world of measurement and into the realm of lies.


Simply graphing the empirical results and using the human eye & mind to predict is more accurate than many peoples math.

Velocity is an optimistic measure. An early objective is to have a predictable team.
Velocity may be a good predictor of release duration. Yet it is always an optimistic predictor.


Variance Graphed: Pessimistic projection (red line) & optimistic projection (green line) of release duration.

While in the realm of fabrication of information — let’s better describe the summary average with it’s variance.

Day 7
Although two stories are now done, the time box is quickly expiring.

Day 8
The team is mired in the largest story.

Day 9
The output of the sprint is quite fuzzy. What will be done for the demo, what do we do with the partially completed work?

The Sprint Demo day. Three stories done (A, B, & D) get demoed to the PO and accepted.

Close the Sprint
Calculate the Velocity - a simple arithmetic sum.


Story C is resized given its known state and the effort to get it from here to done.

What is done with the unfinished story? It goes back into the backlog and is ordered and resized.

Backlog grooming (refinement) is done to prepare for the next sprint planning session.

Trophies of accomplishments help motivation and release planning. Yesterday’s weather (pattern) predicts the next sprints velocity.


Day 2
Work begins on yet another sprint.

Day 3
Work progresses on story tasks.

The cycles of days repeats and the next sprint completes.


In this alternative world one wishes to receive partial credit for work attempted. Yet the story was resized based upon the known state and getting it to done.


Sprint 2 Begins with Sprint Planning
Day 1
Three stories are selected by the team. Including the resized (now 8 points) story C.

Day 2
Work begins on yet another sprint.

Day 3
Work progresses on story tasks.

The cycles of days repeats and the next sprint completes.

Close Sprint 2
Calculate the Velocity - a simple arithmetic sum.

In an alternative world we may do more complex calculus. But will it lead us to better predictability?

In this alternative world one wishes to receive partial credit for work attempted. Yet the story was resized based upon the known state and getting it to done.

Simplicity is the ultimate sophistication. — Leonardo di Vinci
Now let’s move from the empirical world of measurement and into the realm of lies.


Simply graphing the empirical results and using the human eye & mind to predict is more accurate than many peoples math.

Velocity is an optimistic measure. An early objective is to have a predictable team.
Velocity may be a good predictor of release duration. Yet it is always an optimistic predictor.


Variance Graphed: Pessimistic projection (red line) & optimistic projection (green line) of release duration.

While in the realm of fabrication of information — let’s better describe the summary average with it’s variance.


Comments